The opportunity
Product decisions needed a clearer picture of usage.
I needed engagement, adoption, usage, and retention data to understand which features people returned to and where further investigation was needed. That context mattered when deciding where to invest design and development effort.
Measurement lacked clear ownership. Engineering needed clearer guidance on what would be useful to Product and UX, while existing numbers were not always straightforward to interpret. I took the initiative to investigate.
Who it helps
The project supports Product, UX, and leadership in understanding engagement, adoption, and usage. Leadership relies on me as the main source of product-usage data and insights informing product direction. I manage the initiative and coordinate its data requirements across teams.
My approach
Manage what needs to be collected
I coordinate what data is sent from the frontend to the backend, working with UI developers and the data-platform team to align collection with Product and UX needs. I investigate existing events, data routing, and gaps so the measurement supports the questions we need to answer.
Build beyond the existing tooling
The existing tools were difficult to use and customize. As I learned more about backend systems through AI coding, I retrieved data through APIs from the OctoBus/Elasticsearch environment and built a working interface with Claude Code.
Help people interpret the metrics
I grouped the page by metric type, placed filtering at the top, and added hover-help icons explaining how calculations were made. The first iteration also uses labels such as “strong,” “good,” and “stable” to offer an interpretation alongside the numbers.
AI helped inform the initial status thresholds. These labels are provisional: their thresholds need validation against the metric definitions, audience, and expected usage of this product.
What works today
A working view of product behavior.
I retrieved telemetry from OctoBus/Elasticsearch through API access and built a working interface with Claude Code. These views show the prototype running with synthetic data.
Designed and built by me with Claude Code. Sample values are not product outcomes.
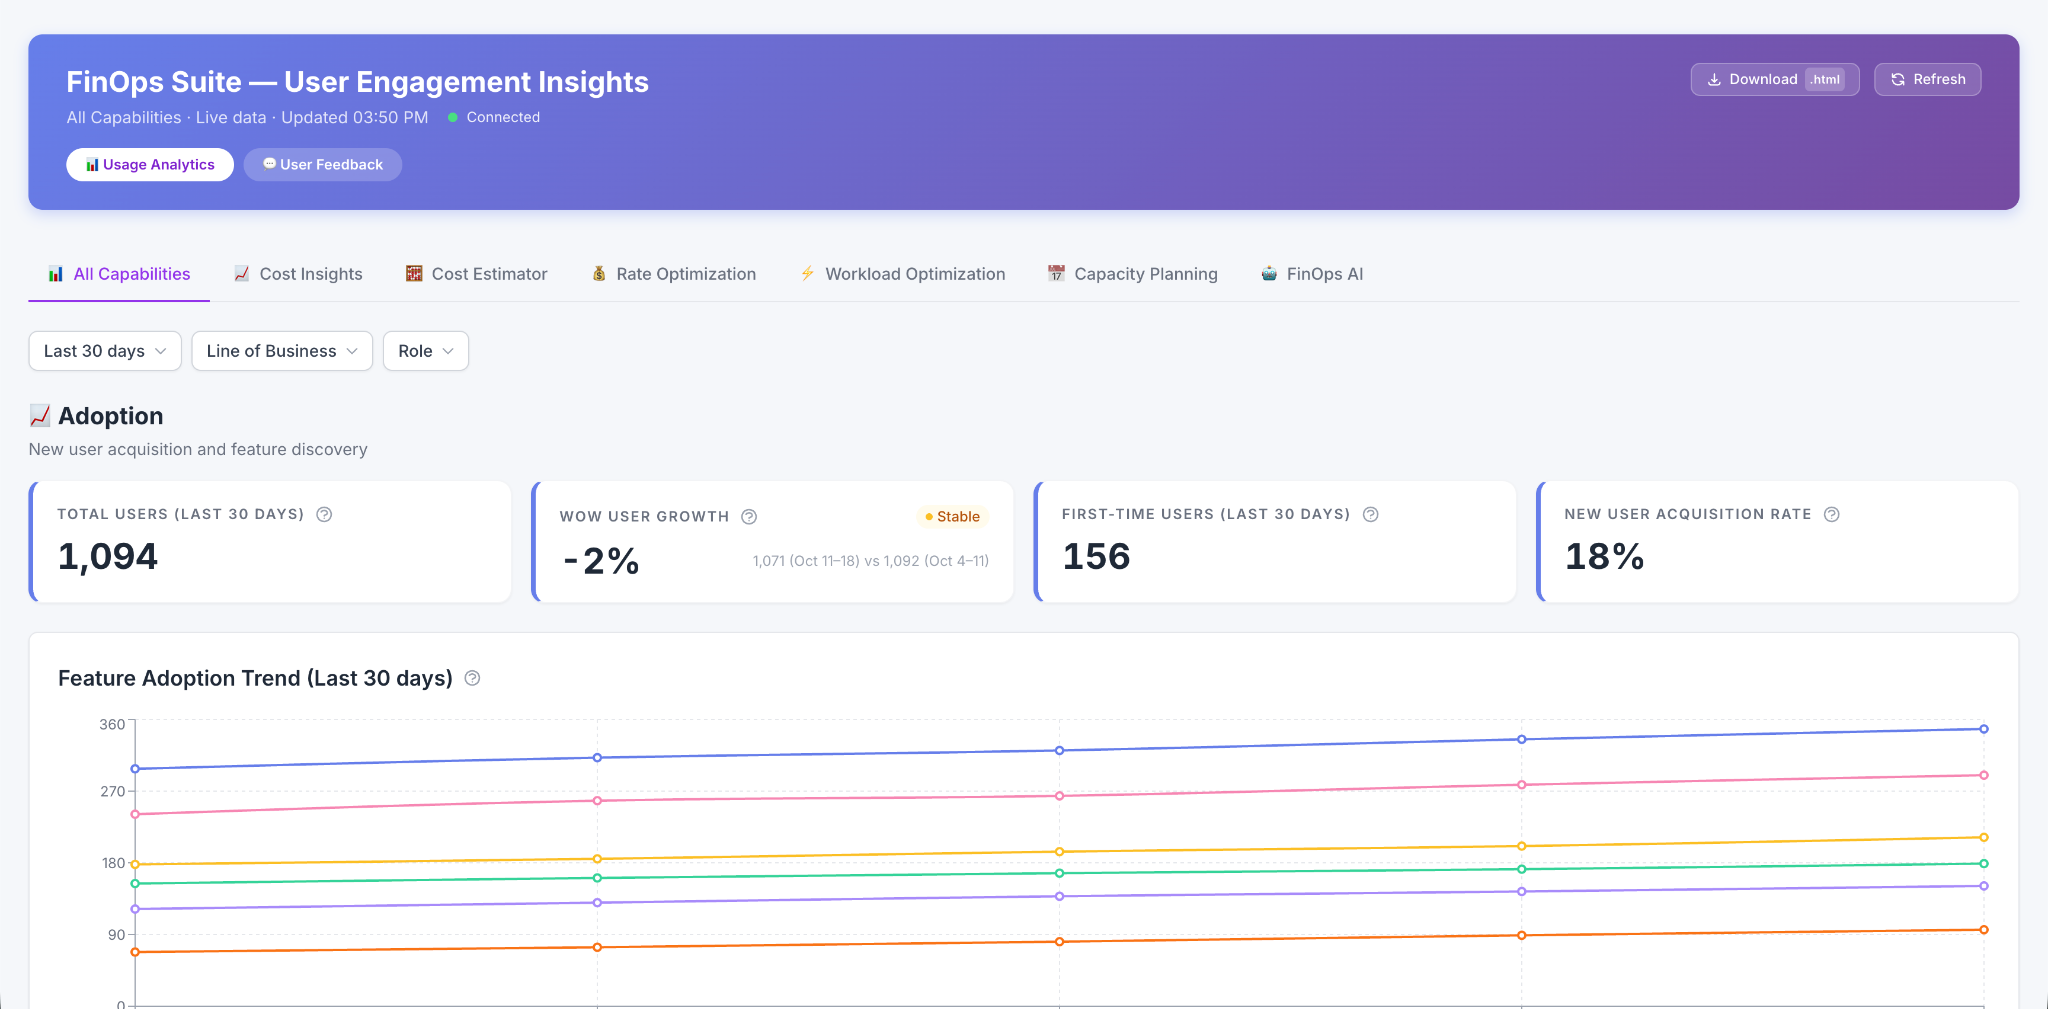
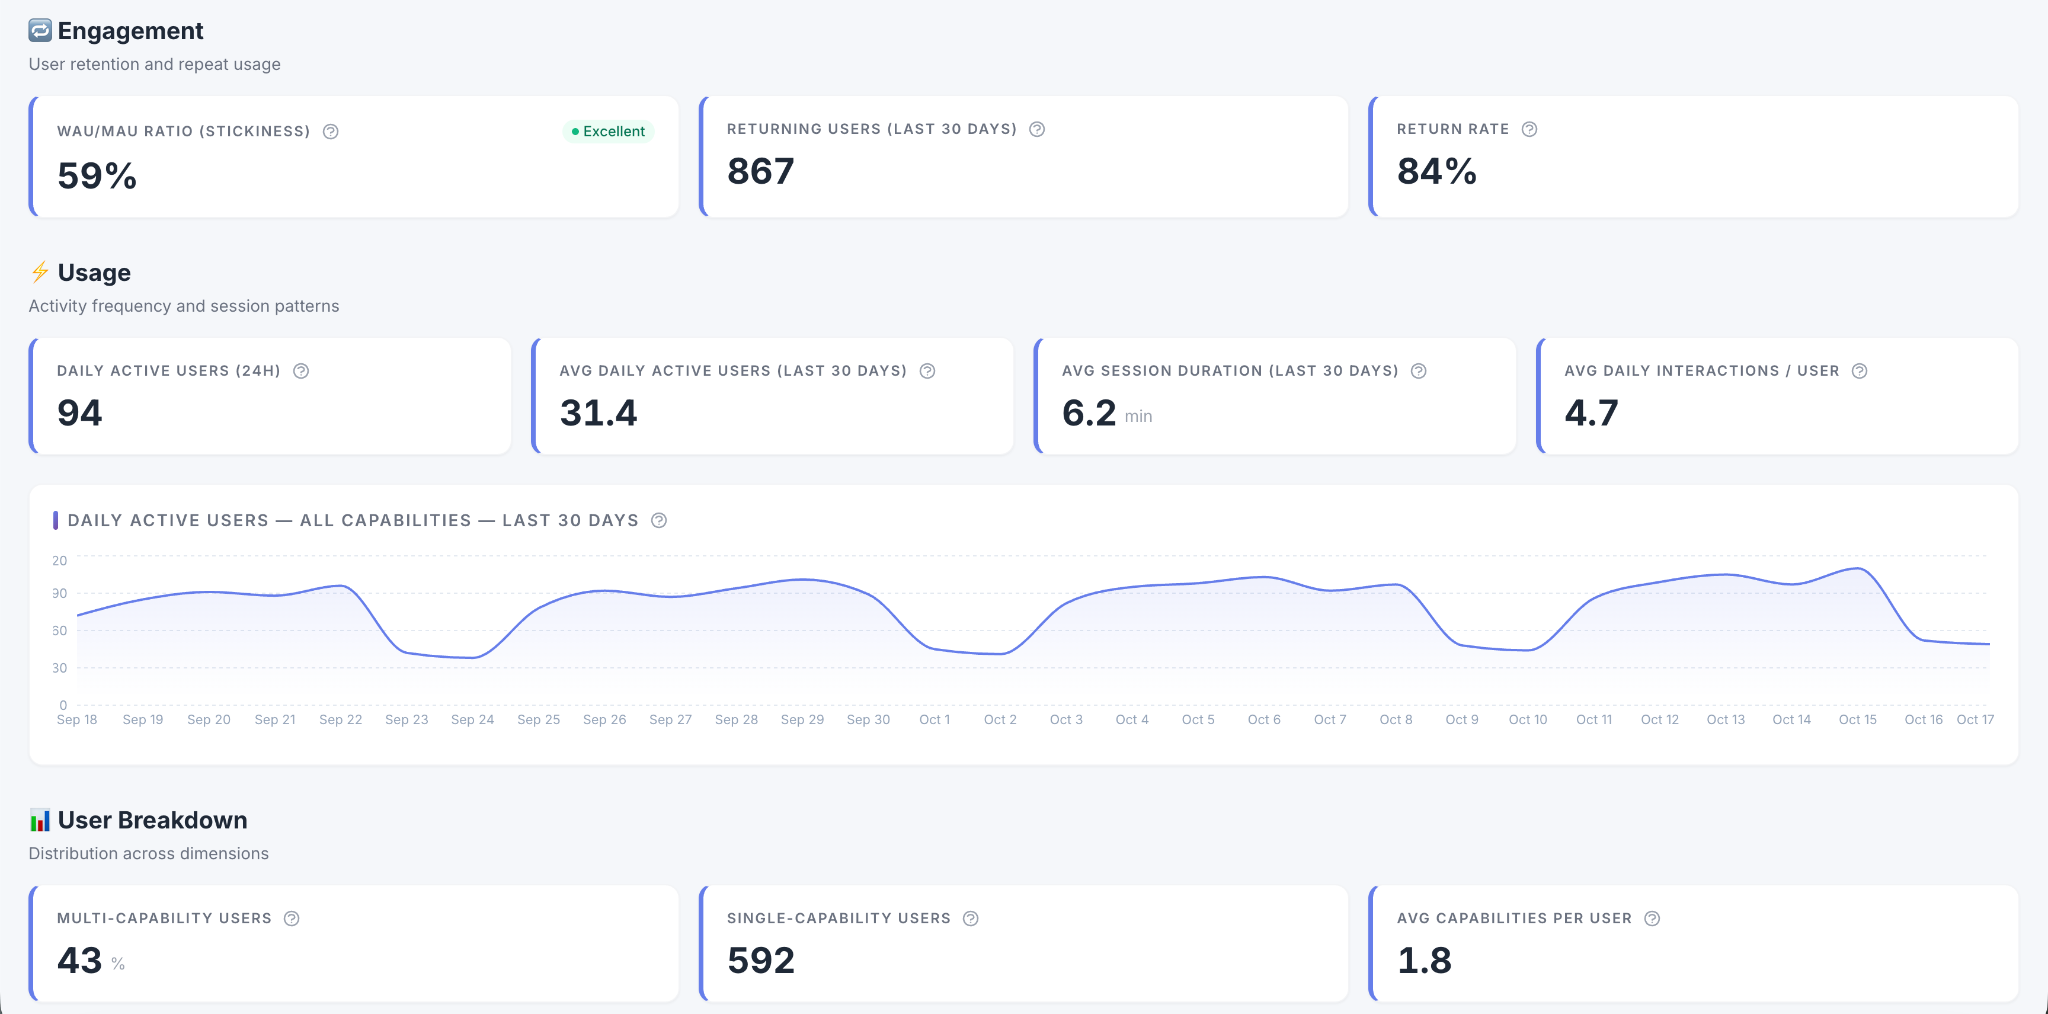
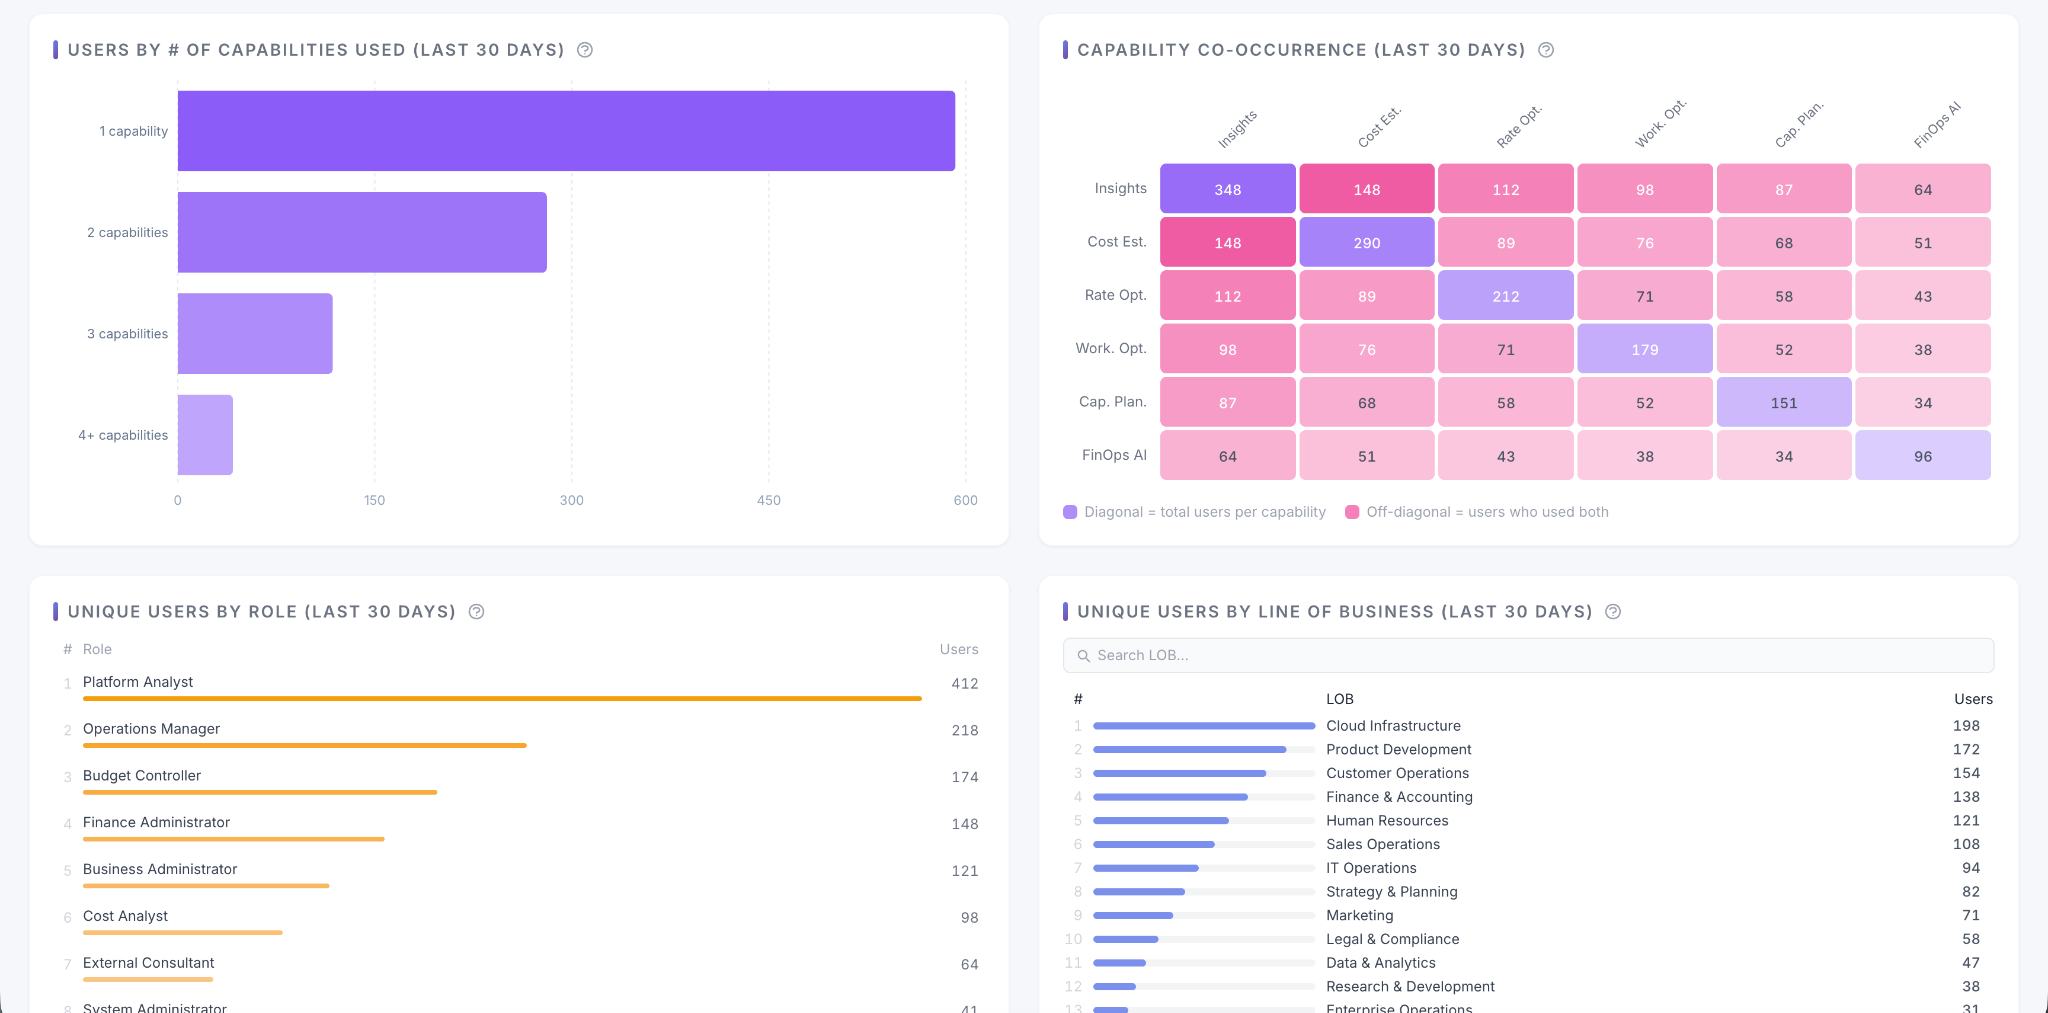
The interface tracks growth, acquisition, WAU/MAU stickiness, return rate, activity, session duration, usage across capabilities, and audience/page usage. Additional tracking, including feature usage within individual pages, awaits the required data. I’m validating metric reliability as development continues.
Progress & next steps
The initiative received organizational support, and I now manage its progress and data coordination. Alongside supplying leadership with usage insights, I’m validating data reliability and developing the backend connections needed for broader distribution of the interface.
The goal is to inform feature investment and roadmap discussions. Usage needs context: high usage alone does not establish value, and low usage can have multiple explanations. Broader rollout and measured decision-making impact are still ahead.